
There’s a lot of confusion around testing memory faults on NVIDIA graphics cards. I get the same questions all the time:
- What system do you use?
- Which Linux version are you running?
- What commands do you use?
- How do you know exactly which memory chip is faulty?
In this article, I’ll walk you through my exact setup and process, using the same USB testing tool I use on every NVIDIA GPU I repair – from the older GTX cards right up to RTX 50-series with GDDR7.
The Test Subjects – Three Damaged RTX Cards with GDDR7
For this demonstration, I’m using three RTX GPUs as examples:
- RTX 5070
- RTX 5080
- RTX 5090
All three of these cards were damaged in shipping. They were shipped with the GPUs still installed inside the PC. When that happens, the weight of the graphics card combined with rough handling during transit can bend the PCB, stress the solder joints, and damage memory or GPU pads. Gravity takes care of the rest, and the cards arrive dead on the bench.
In this particular batch:
- All three cards use GDDR7.
- When installed in a system, they only produce a black screen and the PC does not boot.
- None of them have a cracked PCB (which is another common shipping damage).
The worst of the three is the RTX 5090:
- The cooler is completely wrecked and broken in several places.
- The backplate is badly bent – I’ve straightened it as much as realistically possible, but it’s still not usable as-is.
- Given the physical damage, I fully expect to find broken pads under the memory or the core when they’re eventually lifted.
In this article, I’m not going to repair these three GPUs. Instead, I’ll show you how I identify the faulty memory so that when I do repair them, I already know which channels and banks to focus on.
My Test Bench Hardware
Here’s the exact setup I’m using to test these GPUs:
- CPU: Intel Core i7 6700K
- Motherboard: Z170 chipset
- RAM: 16 GB
- Power Supply: 1550 W Thermaltake PSU
- Display: Connected to the internal graphics output (iGPU)
For the memory tests, the most important things are:
- A system that can boot from USB into Linux.
- A reliable power supply.
- The ability to run the display from the integrated GPU instead of the card you’re testing.
BIOS Setup – Internal Display & Legacy Boot
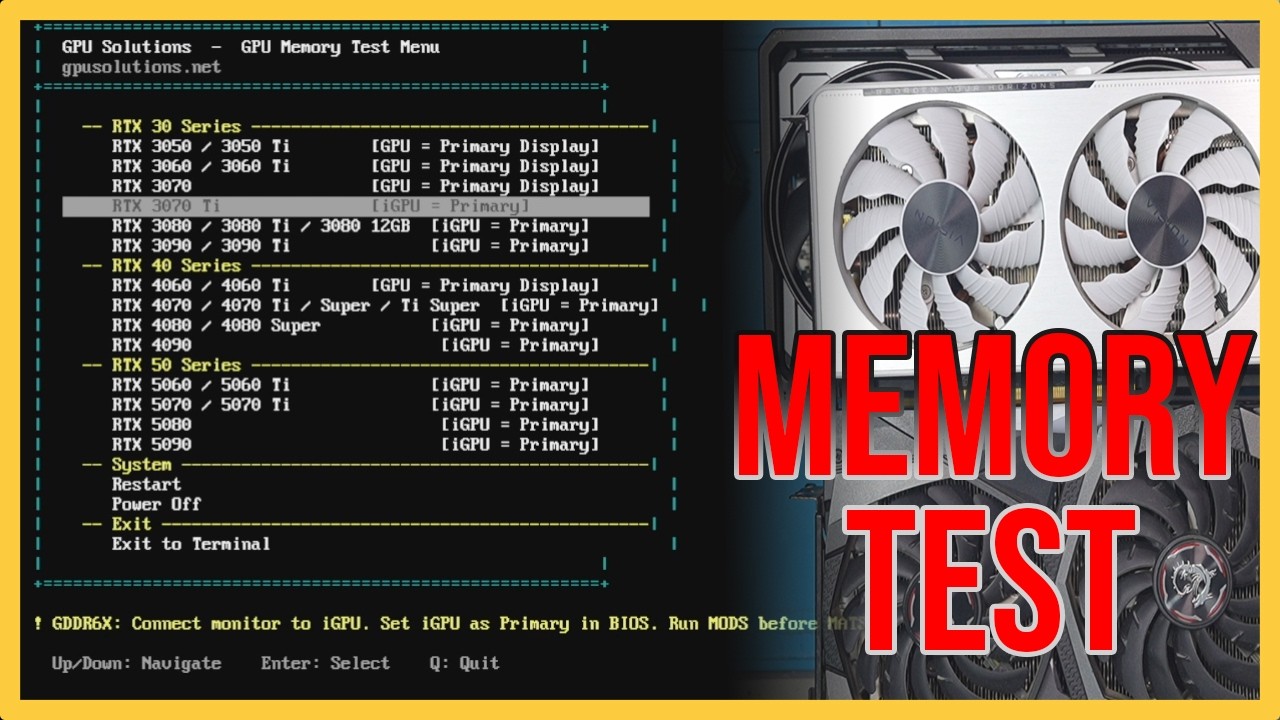
When you’re testing GPUs with GDDR6X or GDDR7 using this method, there’s one key rule:
Always switch to the internal display (iGPU) before running tests.
Here’s what you need to do in the motherboard BIOS:
- Enable CSM / Legacy Boot
The USB I’m using here is a legacy version, so you need legacy boot (CSM) enabled. - Switch the primary display to iGPU
Change the display setting from Auto or PCIe to iGPU (the internal graphics from the CPU).
If your CPU does not have an integrated GPU, you’ll need a second graphics card to act as the primary display output. That complicates things a bit, but the testing process is the same once Linux is up.
The USB & Linux Environment I Use
On my side, I’m using a custom-built USB stick that boots into a small Linux environment (Tiny Linux 18 in this case), with testing software organized by GPU generation. The same stick supports:
- GTX series
- RTX 20 series
- RTX 30 series
- RTX 40 series
- RTX 50 series (including GDDR7 cards)
For GDDR6X and GDDR7 cards, MODS is all you need to identify faulty memory channels and banks. Everything we do below is based around running MODS and reading its log file.
Step 1 – Booting and Checking That the GPU Is Detected
The process is the same for all three GPUs. I’ll walk through it using the RTX 5070 first.
- Plug in the legacy USB stick with the memory testing software.
- Install the GPU you want to test on the bench.
- Boot from the USB. Wait for the GRUB/menu screen, then boot into the Linux environment.
Once you’re at the Linux shell, the first thing I always do is confirm that the GPU is detected on the PCIe bus:
lspci
This command lists all devices connected to the PCIe bus. If your GPU shows up there, you’re good to continue.
On my USB, each GPU type has its own directory. For example:
- RTX 5070 –
570.215_5070 - RTX 5080 –
570.215_5080 - RTX 5090 –
570.151_5090
So the next step is to change into the folder for the card you’re testing, then run MODS from there.
Step 2 – Running MODS to Test GDDR6X / GDDR7 Memory
Once you’re in the correct directory for the GPU, you run the MODS test using this command:
./mods gputest.js -skip_rm_state_init
This command is what I use on all the examples below (RTX 5070, RTX 5080, and RTX 5090). On my USB, the required files and scripts are already set up per GPU, so I just change into the right folder and run the same command.
MODS will:
- Run a series of VRAM tests on the GPU.
- Write the result into a log file called
mods.login the same directory.
For GDDR6X and GDDR7 cards, MODS alone is enough to identify which channel and bank of memory is failing.
Step 3 – Opening the MODS Log File
After the test completes, we need to read the log file to find out which memory channels are bad. To open mods.log, use:
nano mods.log
This opens the log file in the nano text editor.
Now scroll down through the file until you find a section that looks like this (or similar):
NV_PFB_FBPA_training_cmd
Under that section, you’ll see entries for each memory channel, one after another:
- FBPA_0 – Channel A
- FBPA_1 – Channel B
- FBPA_2 – Channel C
- …and so on
Each entry has a training status code. We’re interested in the last digit or alphabet of that code.
How to Decode the MODS Memory Training Codes
This is the key rule to remember:
- If the last digit is 2 → Bank 0 on that channel is faulty.
- If the last digit is 8 → Bank 1 on that channel is faulty.
- If the last digit is A → Both banks (0 and 1) on that channel are faulty.
So the process is:
- Find the
NV_PFB_FBPA_training_cmdsection. - Map FBPA index to channel letter:
- FBPA_0 → Channel A
- FBPA_1 → Channel B
- FBPA_2 → Channel C
- …and so on.
- Look at the last character of the training code for each entry.
- Use the rules above to determine which bank is faulty on which channel.
At first the data looks intimidating, but once you’ve read a few of these logs, it becomes much easier to read. The pattern starts to jump out at you.
Example 1 – RTX 5070: Fault on Channel A0
On the RTX 5070, I followed this process:
- Install the GPU on the bench.
- Boot from the USB using the internal display.
- Confirm the GPU is detected with
lspci. - Change into the
570.215_5070directory. - Run:
./mods gputest.js -skip_rm_state_init - Open
mods.logwithnano mods.log.
In the log, under NV_PFB_FBPA_training_cmd, I saw that:
- The code for FBPA_0 (channel A) ended with 2.
According to the rule:
- Last digit 2 → Bank 0 is faulty.
So the faulty memory on this card is Channel A, Bank 0 (A0).
In practical terms, that usually means broken pads under the A0 memory module or broken connections under the GPU core that connect to that A0 module.
Example 2 – RTX 5080: Faults on A0 and B1
On the RTX 5080, the steps are identical, just with a different folder:
- Install the GPU on the bench.
- Boot from the USB into Linux using the internal display.
- Confirm the GPU is detected with
lspci. - Change into the
570.215_5080directory. - Run:
./mods gputest.js -skip_rm_state_init - Open
mods.logwithnano mods.log.
In the log, under NV_PFB_FBPA_training_cmd, I found:
- FBPA_0 (Channel A) – Code ended with 2 → A0 is faulty.
- FBPA_1 (Channel B) – Code ended with 8 → B1 is faulty.
So for this RTX 5080, the faulty memory locations are:
- Channel A, Bank 0 → A0
- Channel B, Bank 1 → B1
Again, the log doesn’t tell you whether the problem is under the memory chip or under the core – it just tells you which memory locations are failing.
Example 3 – RTX 5090: Faults on A1 and the Entire H Channel
Now let’s look at the most heavily damaged card of the three – the RTX 5090 with the wrecked cooler.
Despite the broken cooler and bent metal, the PCB itself is not cracked, so we can still run our tests.
The process is the same as before:
- Install the RTX 5090 on the test bench.
- Boot into Linux from the USB.
- Check the GPU is detected with
lspci. - Change into the
570.215_5090directory. - Run:
./mods gputest.js -skip_rm_state_init - Open
mods.logwithnano mods.log.
The RTX 5090 in this example has 16 memory chips, which means:
- 8 memory channels (A to H)
- Each channel has two banks:
- A0 / A1
- B0 / B1
- … up to H0 / H1
Looking at the training results:
- Channel A – Code ends with 8 → A1 is faulty.
- Channel H – Code ends with A → Both H0 and H1 are faulty.
So on this card:
- Channel A, Bank 1 → A1 is faulty.
- Channel H, Banks 0 and 1 → H0 and H1 are both faulty.
Again, this tells us where the memory faults are, not whether the cause is under the memory modules or under the core. To know that, we’d have to lift the memory and core and inspect the pads.
What MODS Can and Can’t Tell You
To summarize:
- MODS will tell you:
- Which channel (A–H) is affected.
- Which bank (0 or 1, or both) is faulty on that channel.
- MODS will not tell you:
- Whether the fault is due to broken pads under the memory module, or
- Broken pads under the GPU core that connect to that module.
That part you only discover during the actual repair, when you lift parts and inspect the pads.
Do You Need to Be a Repair Tech to Run These Tests?
To run the tests – no.
Anyone who can:
- Install a GPU on a bench setup,
- Boot a system from USB,
- Type a few commands in Linux, and
- Scroll through a log file,
…can run these tests and figure out which memory channel is faulty.
But to repair the faults – replacing memory modules, reballing cores, fixing broken pads – you absolutely need to be a skilled technician with the right equipment and practice. That’s a completely different level of work.
Where to Get the NVIDIA Memory Testing Software
This is the part everyone asks about: Where do I get this software?
The tools themselves are not something you’ll easily find by typing a phrase into a search engine. There are a couple of ways to get them:
- You can join communities like the Learn Electronics Repair Discord (Richard) or Northwest Repair (Tony) where the basic toolset is shared for free, and then build your own USB.
- Or you can buy a ready-to-use, cloned version of the testing USB that I use, with all the cleanup and organization already done for you.
I’ve taken the freely available pieces, fixed the errors and hiccups I encountered, organized everything per generation, and bundled them into a plug-and-play environment on a 16 GB USB stick.
My Ready-to-Use NVIDIA VRAM Test USB
If you don’t want to spend hours building and debugging your own test stick, you can order the exact USB I use on my bench.
When you buy my VRAM Test USB, you’ll receive:
- A 16 GB USB stick with:
- Memory testing tools for GTX series right up to RTX 5090.
- Organized folders for different generations and cards.
- A list of commands you can use to test memory on NVIDIA GPUs.
- A cleaned-up, plug-and-play environment where:
- The common errors have been ironed out.
- The structure is clear and easy to follow.
You’re not paying for the tools themselves – they’re freely available in the community. You’re paying for the build, organization, cleanup, and documentation that makes the whole process much easier and more reliable.
To buy the USB testing tool I created, head over to my website and place your order. If your country is not listed in the shipping options, just drop me an email and I’ll add it for you.
Final Thoughts
With the right USB and a simple Linux environment, identifying faulty memory on NVIDIA GPUs – even modern GDDR6X and GDDR7 cards – is very doable.
MODS gives you a clear map of:
- Which channels are bad (A–H), and
- Which banks (0 or 1, or both) are failing.
From there, a repair technician can decide whether the problem is likely under the memory or under the core, and plan the repair accordingly.
If you enjoy this type of content and want to see more real-world GPU diagnostics and repairs, don’t forget to follow my YouTube channel GPU Solutions. You can also support the channel by:
- Subscribing and turning on notifications,
- Becoming a member, or
- Using the Thanks button for a one-time contribution.
To buy and download the cloned version of my USB’s visit my Online Shop.
Thank you for reading, and I’ll see you in the next article. Cheers!


Recent Comments